A Cache Hit Is Not the Unit of Latency
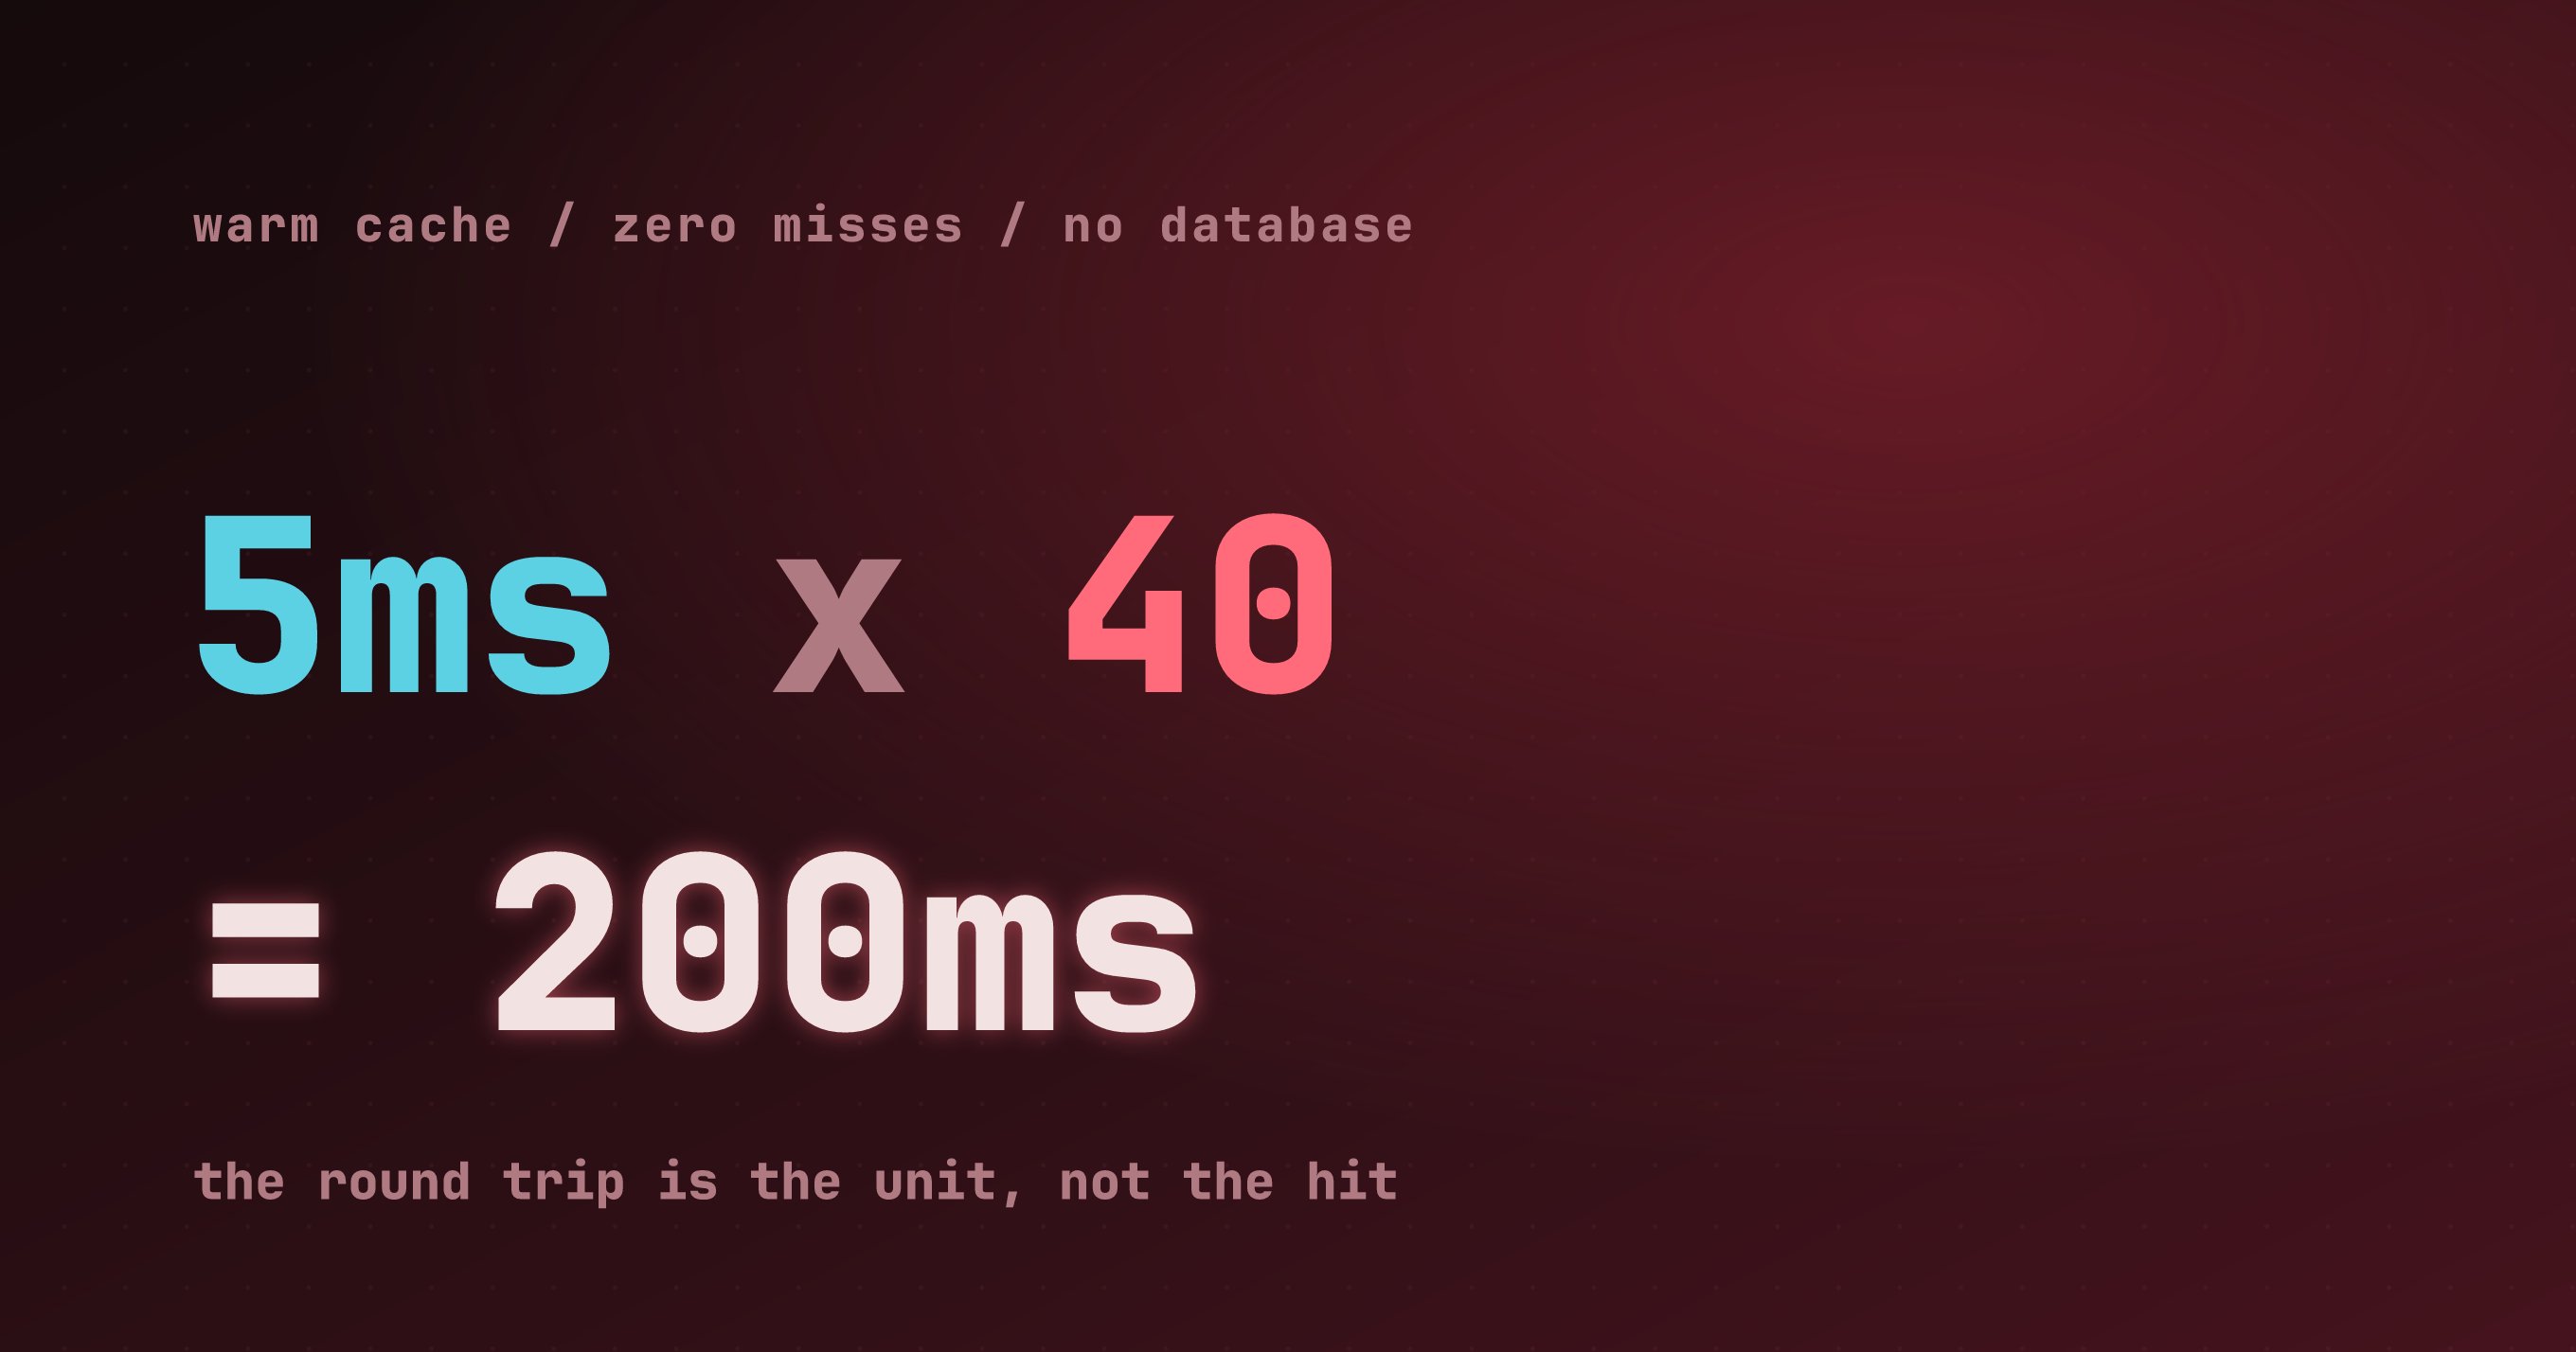
“First Law of Distributed Object Design: don’t distribute your objects.” Martin Fowler
Every lookup in this endpoint was a cache hit. Not most of them, every one. The data it needed was already warm in Redis, no database anywhere on the path. And a single request took the better part of a third of a second.
The work was nothing. The trips were everything. The endpoint was slow not because it computed anything or waited on disk, but because it crossed the network to the cache and back around forty times for one request, one item at a time, in a row.
Here is where this goes. This is the N+1 problem, the one every backend engineer is trained to spot against a database, sitting one layer over against a cache, where almost nobody thinks to look. A cache hit feels free. Forty sequential cache hits are not.
A note on numbers: the figures here are illustrative and rounded. The shape is the point.
Four terms, defined once:
Round trip: one request from the service to another box, here the cache, and the response back. Even on a fast network it costs a fixed slice of time, a few milliseconds, no matter how little data moves.
Pipelining: sending many commands to the cache in a single round trip and reading all the answers together, instead of one command per trip.
N+1: the pattern where fetching one thing quietly fires N more calls, one per item, instead of one batched call. Famous against databases, just as real against a cache.
In-memory cache: a copy of data kept inside the service’s own process, with no network hop at all, usually with a short expiry so it does not drift too far from the source.
The setup
The endpoint is an inventory lookup. Give it a set of item ids, optionally a set of locations, and it returns stock. Two things happen on the way: it validates the locations on the request (are they real, active, eligible), and it reads the inventory for the items. Both reads are served from a Redis cache. There is no database call on this path. Everything is a hit.
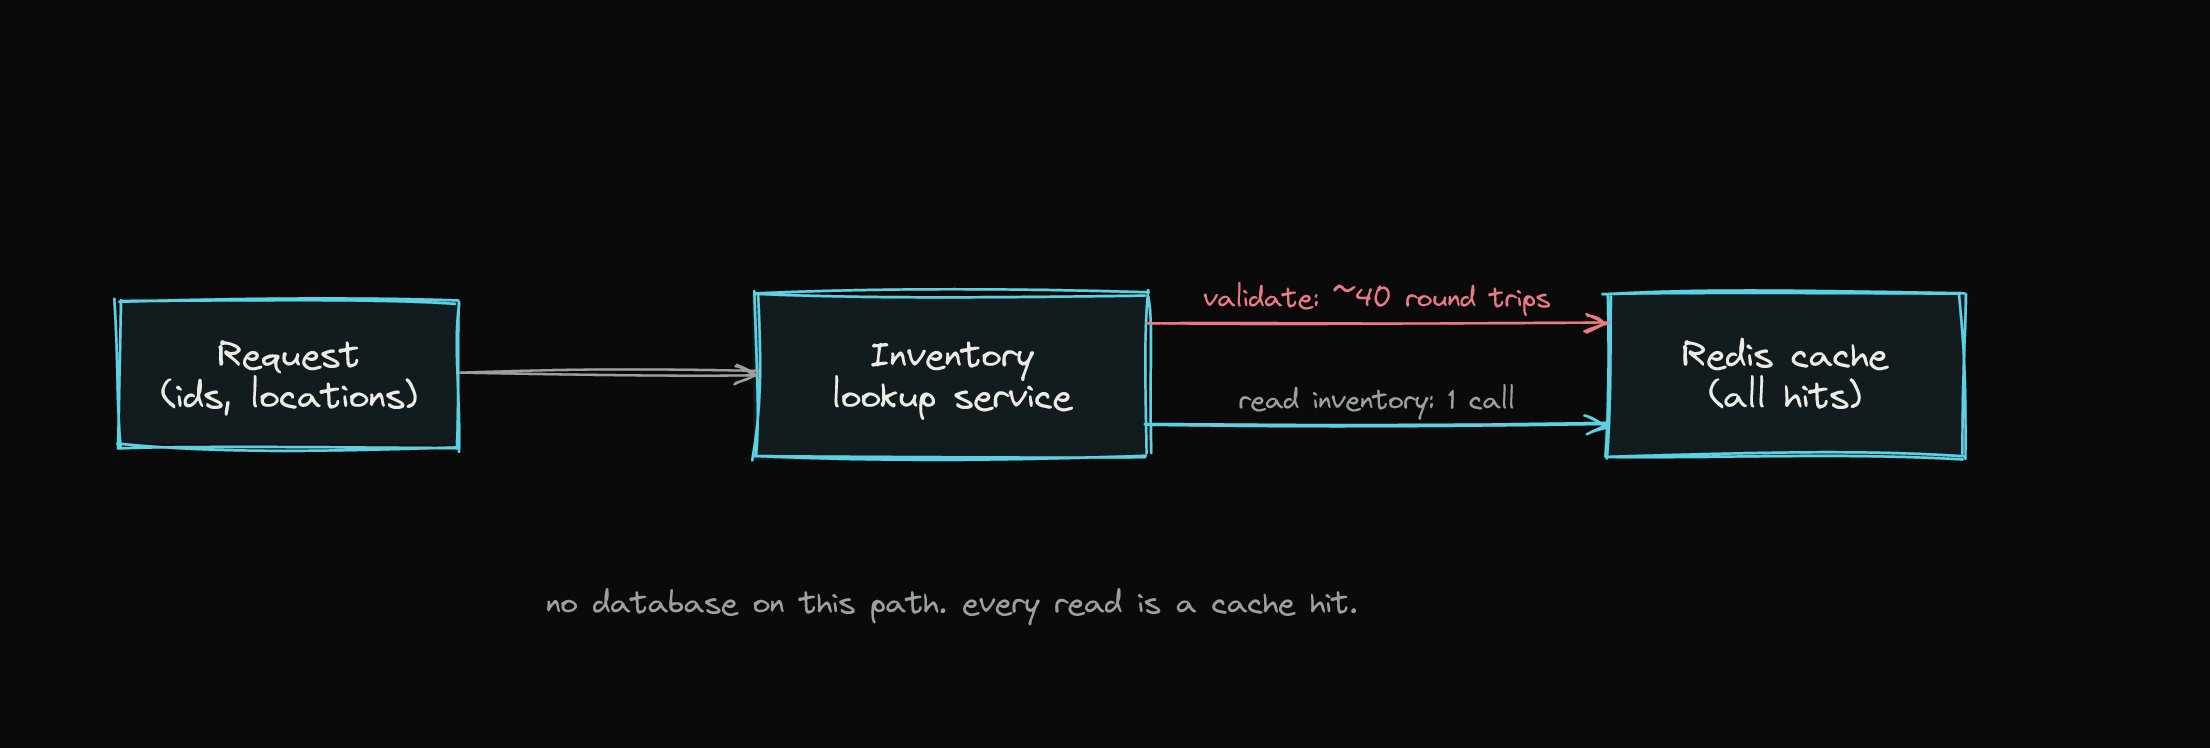
So when the numbers came back slow, the usual suspects were all absent. No cache misses. No database. No heavy computation. Just hits, and yet a third of a second per request.
The number that did not add up
A read from a warm cache is a few milliseconds. Even a few dozen of them should land in the tens of milliseconds. We were seeing a third of a second. That gap is the entire story, and you only find it by refusing to accept an aggregate. “The endpoint is slow” is not a finding. Where, exactly, did the time go.
Where the time went
I broke one request into its parts and timed each. The large majority of the time was in location validation. Not because validation is hard, it is a lookup, but because of how it was done. For each location on the request, the code made its own separate call to the cache:
for (String locationId : locationIds) {
    LocationInfo info = cache.get("locations", locationId);  // one round trip, every time
    valid.add(info);
}
Around forty locations, around forty separate round trips, run one after another. Each trip is individually quick, a few milliseconds, and individually it looks fine in the code. Sum them and they are most of your response time.
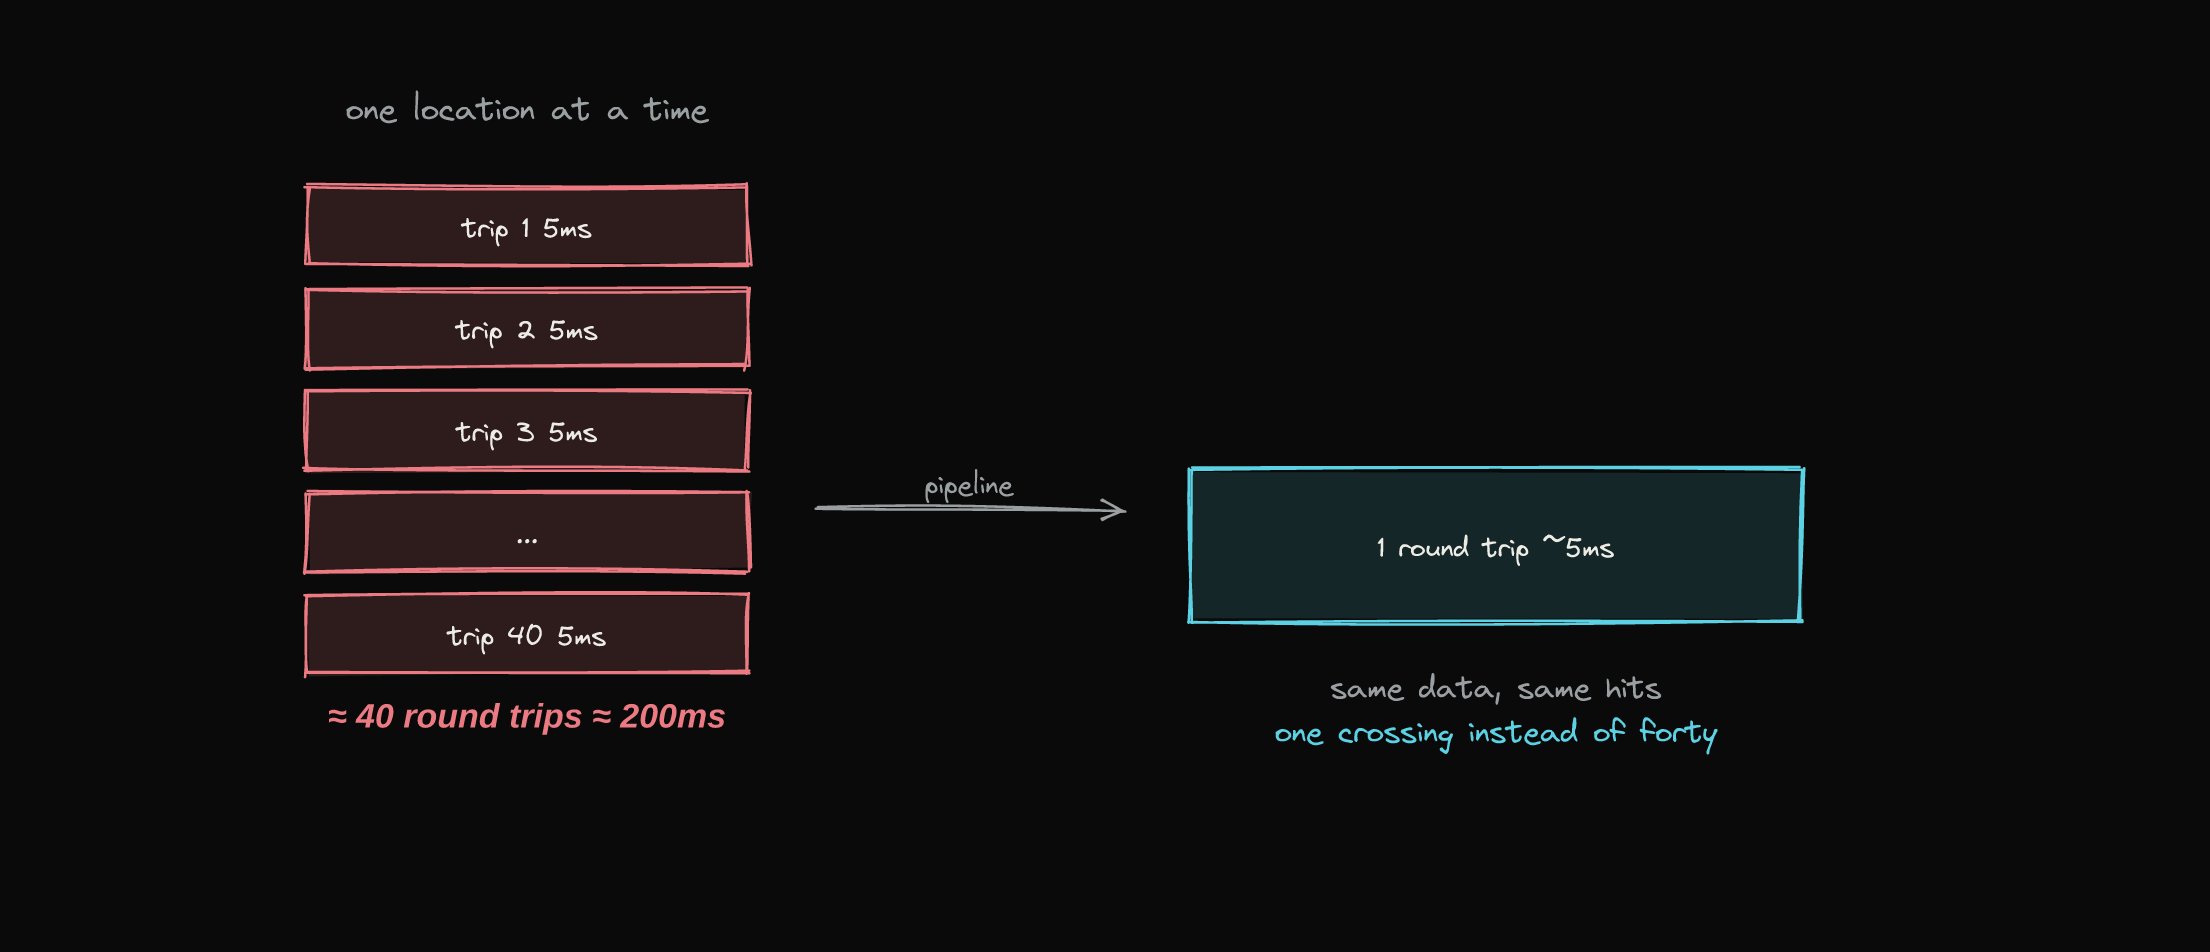
The data was in the cache the whole time. Every one of those forty calls was a hit. The cost was not fetching the data. It was asking forty separate times.
The reframe: the round trip is the unit
Here is the shift. When you reason about cache performance you think in cache hits, and a hit is fast, so you assume you are fine. But the cache hit is not the unit of latency. The round trip is. A request that makes forty sequential round trips pays for forty, hit or miss. A warm cache saves you nothing if your code is chatty enough to cross the network forty times to use it.
A connection pool softens this but does not solve it. A pool, Lettuce or Jedis in Java, keeps a set of live connections open so you are not paying the TCP and TLS handshake on every call, and that tax is real, the handshake can cost more than the small lookup it carries. Without a pool, forty calls in a loop means forty handshakes and forty sockets churning through the ephemeral port range, which fails in its own loud way under load. But even with a perfectly warm pool, the network transit is still paid per trip. Pooling removes the setup cost. It does not remove the forty crossings. The only thing that removes the crossings is making fewer of them.
Put the other way around: the latency tracked the number of times the code talked to the cache, not the amount of data it moved or the work it did. Once you measure round trips instead of operations, the fix stops being a mystery.
The fix, in layers
First, collapse the forty trips into one. The cache can take many commands in a single round trip and hand back all the answers together. Same data, same hits, one crossing instead of forty:
List<Object> results = cache.pipeline(p -> {
    for (String locationId : locationIds) p.get("locations", locationId);
});
That alone took validation from most of the budget down to a rounding error.
On the wire, the change is the shape of the conversation, not the volume of data:
Sequential (40 trips):
  app  --get loc 1-->  redis      (block, wait a full round trip)
  app  <--value 1----  redis
  app  --get loc 2-->  redis      (block again)
  app  <--value 2----  redis
  ... repeat 40 times ...

Pipelined (1 trip):
  app  --get 1, get 2, ... get 40-->  redis
  app  <--value 1, 2, ... 40--------  redis      (block once)
The sequential version blocks forty times, and each block is a full network round trip the application sits idle through. The pipelined version blocks once.
Batching helps the far side of the wire too. Redis runs commands on a single thread, so forty separate calls are forty packets to parse and forty passes through its socket handling, interleaved with every other service hitting the same cache. One pipelined batch is one parse and one pass. You are not only cutting your own response time, you are being a lighter client on infrastructure everyone shares.
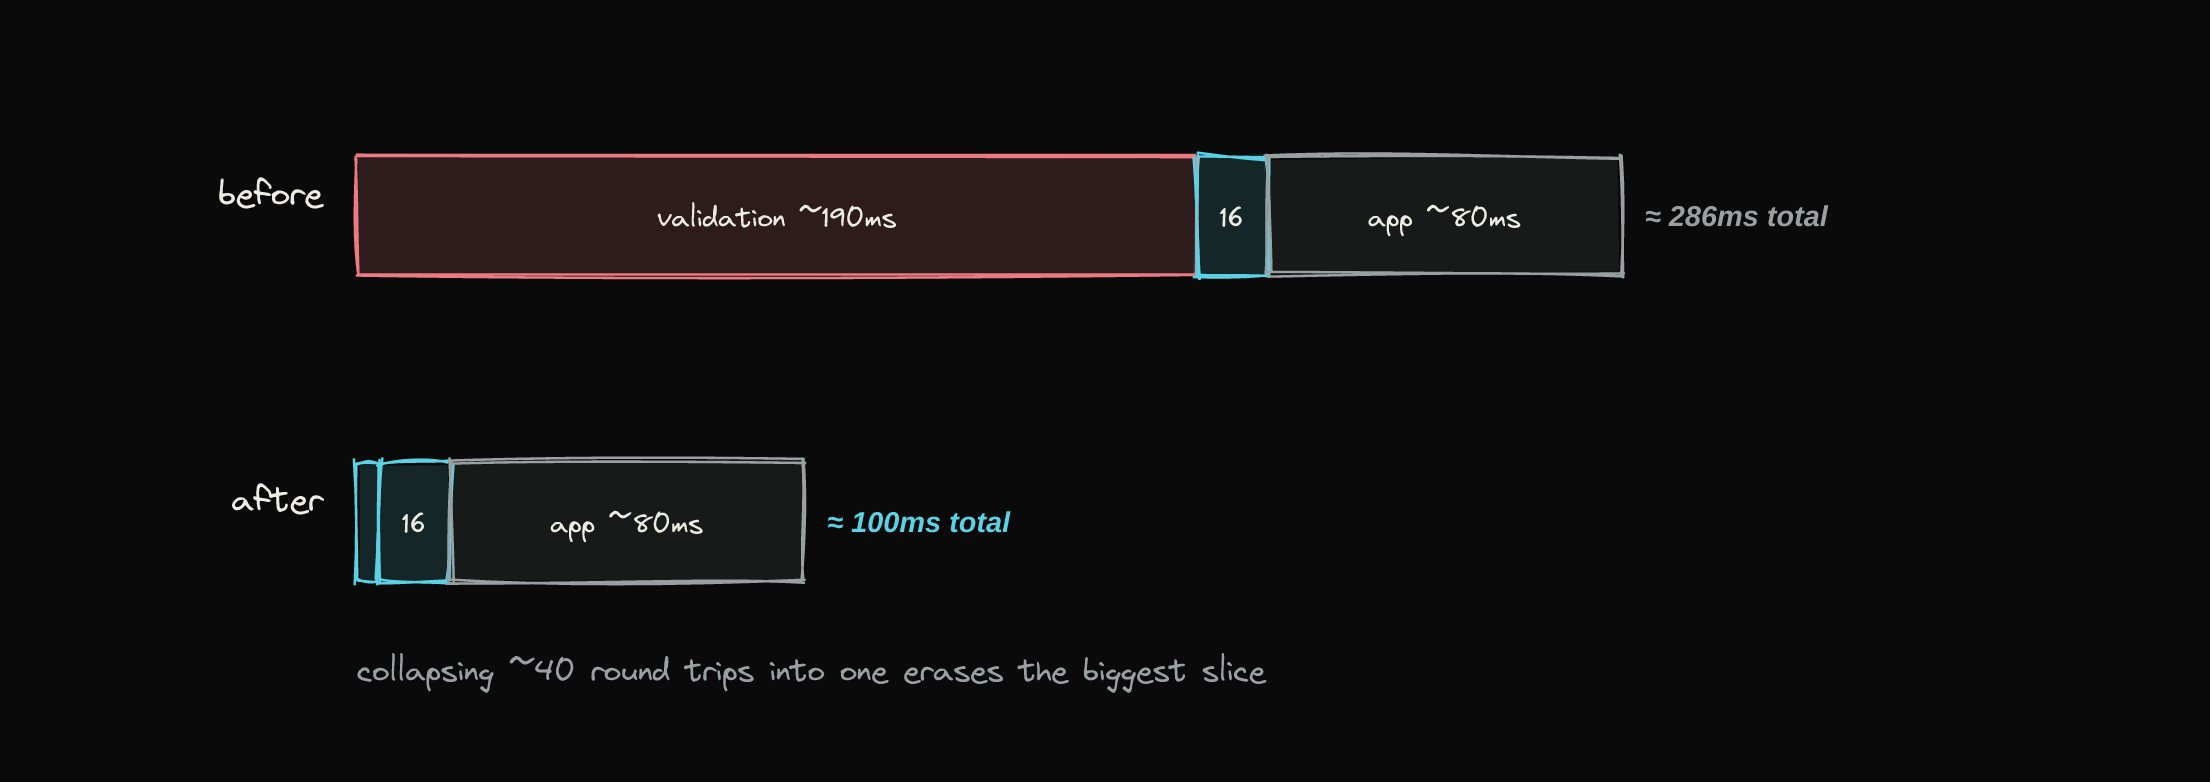
Then the better question: why hit the cache for this at all. Location data barely changes, maybe once a day. Data that is small and nearly static does not belong behind a network hop on every single request. Hold it in memory inside the service, refresh it on a short timer, and the forty round trips become zero:
@Cacheable(value = "locations" /* refreshed on a short TTL */)
public List<LocationInfo> validate(List<String> ids) { ... }
The tradeoff is honest and worth saying out loud. An in-memory copy can be slightly stale. For location metadata that changes once a day, a few minutes of staleness costs nothing. For inventory counts that change by the second, it would be unacceptable, and that data has to stay on the live cache. The right layer depends entirely on how fast the data moves. That is a judgment call, not a default.
Where else this hides
The cache N+1 is one face of a general problem: code that treats a remote call like a local one. Places to look in your own systems:
- A loop that fetches one item at a time from any remote store, cache, database, or service. If the call count grows with the size of the input, you have an N+1.
- An ORM lazily loading a field inside a loop, firing a query per row without anyone writing the query.
- A handler that calls three services in sequence when it could call them in parallel, paying the sum of their latencies instead of the largest.
- Validation or enrichment that hits the network for data that changes hourly or daily and could safely live in memory.
Why it happened
The loop was the natural way to write it. Fetch each location, check it, move on. Every individual call was correct and fast, and in a unit test with two locations it was invisible. The cost only existed in aggregate, at real fan-out, under load, and nothing in the review of a single readable loop shouts “this is forty network round trips.” The cost was real, but it was spread thin across forty innocent-looking iterations, which is exactly where this kind of cost likes to hide.
Takeaways
Count round trips, not operations. When something backed by a fast store is slow, stop staring at the operations and count the times you cross the network. The unit of remote latency is the trip, and trips inside a loop pile up where no single line looks expensive.
Batch by default when you talk to a remote store. If you are fetching many things, fetch them in one call. Pipelining and batch reads exist precisely because the round trip, not the lookup, is the cost.
Match the cache layer to how fast the data moves. Near-static data belongs in memory, not behind a per-request network hop. Fast-moving data has to stay on the shared cache. Choose the layer on purpose.
Fowler’s law was written about distributed objects, but the lesson outlived the decade. Every network hop costs the same whether it carries a byte or a kilobyte. Make as few of them as the work truly needs, and a warm cache will finally be as fast as you already assumed it was.