The two-second floor: when the cheapest query dominates
“Bottlenecks occur in surprising places.” — Rob Pike
A batch job I worked on rebuilt an inventory cache from a Postgres database. It moved tens of millions of rows per run. When I profiled where the time went, the answer was not in the tens of millions of rows. It was in a query that returned a single word per location, the kind of query you would never think to look at. That query was the whole problem, and fixing it had nothing to do with making it faster.
A couple of terms first:
A reconciliation job here is a process that walks every location, reads its true state from the database, and writes the rebuilt result into a cache.
A covering index is an index that contains every column a query needs, so the database can answer from the index alone without touching the table.
The figures below are illustrative and hypothetical. The shape of the problem is what matters, and it holds whatever the exact numbers were.
The setup
The job processes locations one at a time. There are a few thousand of them, and they vary enormously in size. A handful are huge, with hundreds of thousands of items each. Most are tiny, a few hundred items, and there are thousands of those.
For each location the job runs a small set of queries. Two of them pull the actual data, the inventory and the reservations. A third pulls one small thing: the location’s type, a single label the job needs to decide how to handle that location. Then it joins, hashes, and writes to the cache.
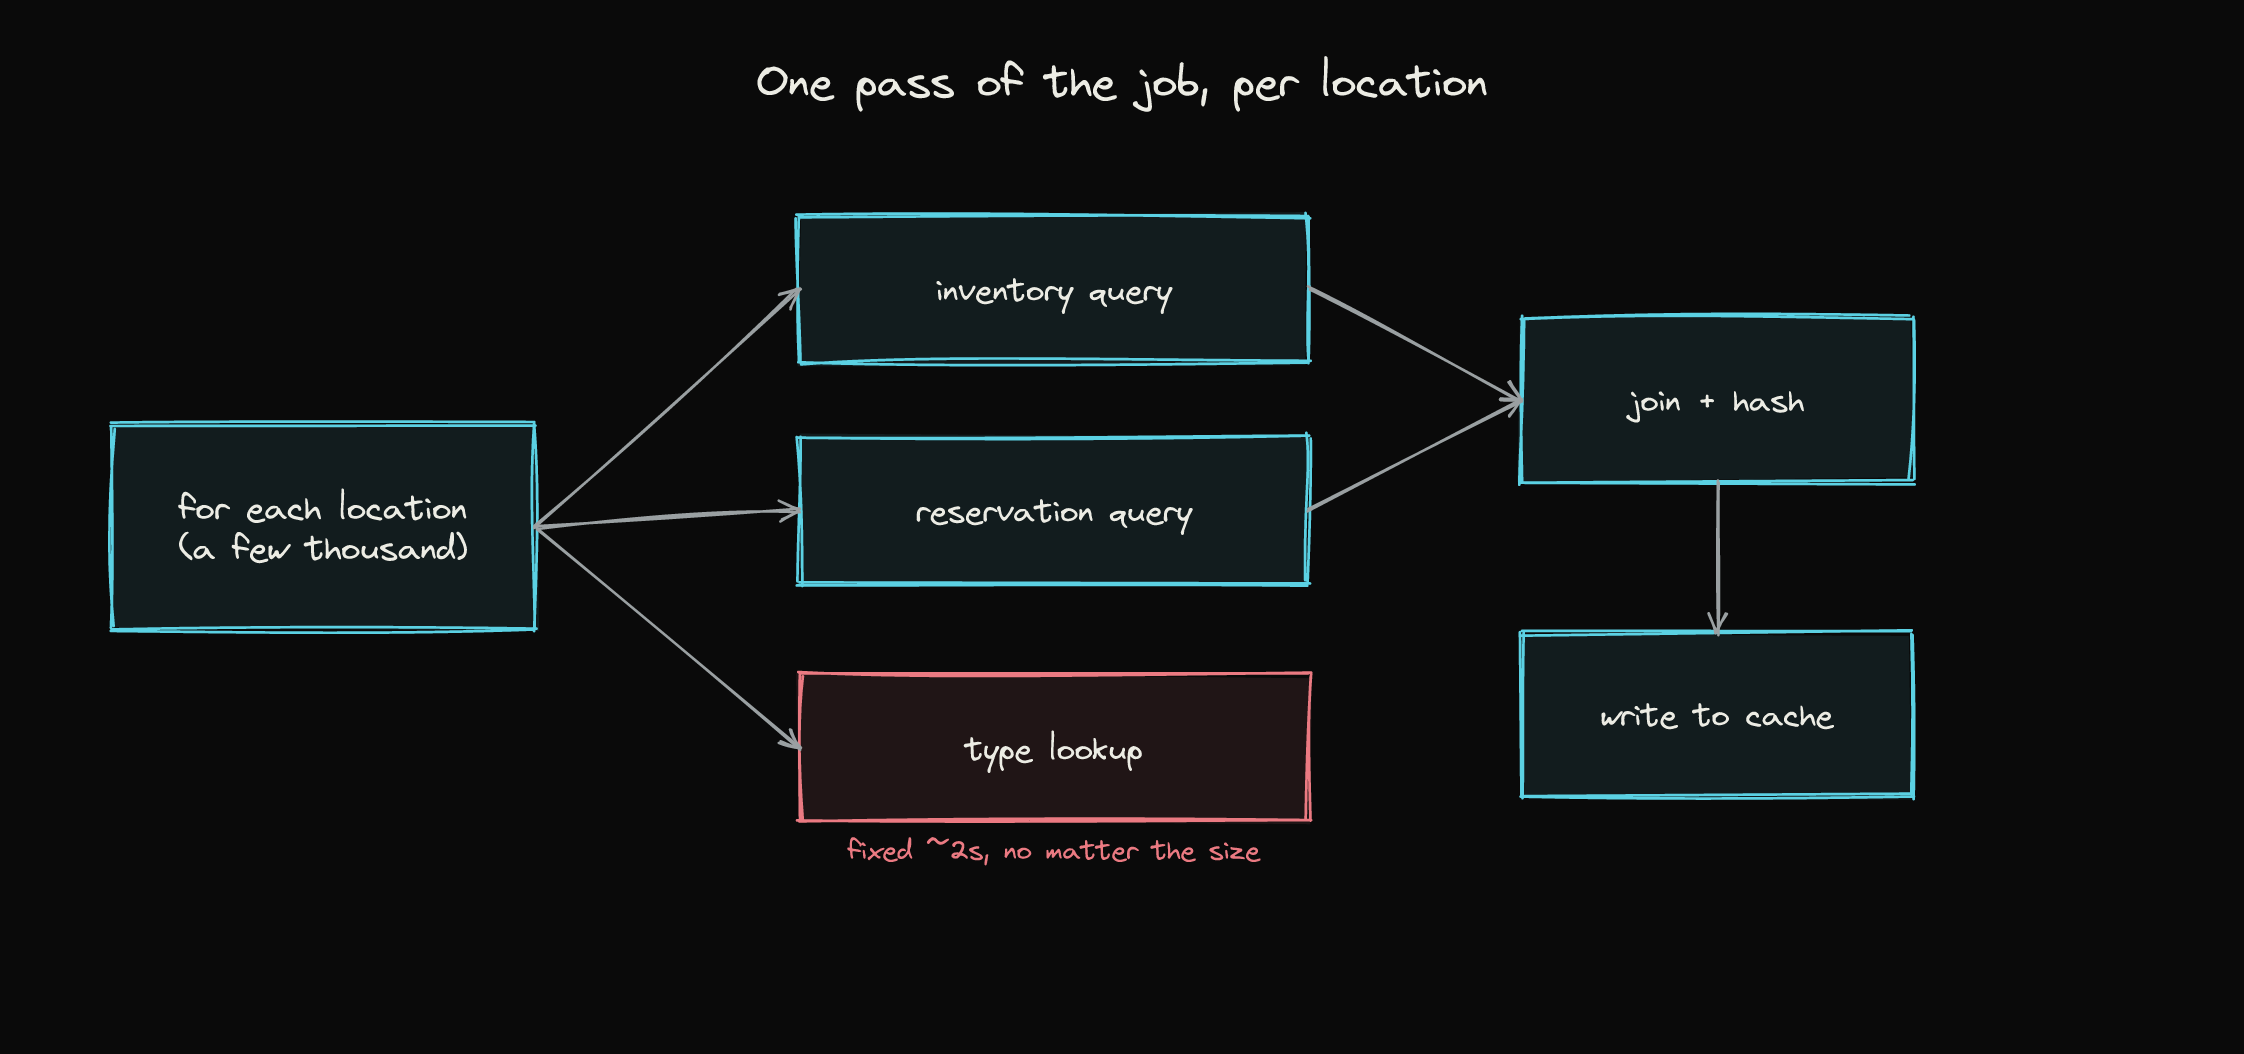
On paper the type lookup is the cheapest thing in the loop. It returns one value. It is the last query you would suspect.
The problem
The lookup only drew my eye for an unrelated reason: I needed to change which table it read from. The obvious way to do that was to fold it into the main data query with a join, so before committing I pulled the query plan.
The plan was a sequential scan over the entire table, millions of rows, to return a single value. The cost came from scanning the table, not from the one row I wanted, and it did not depend on the location filter at all. There was no index that covered the lookup, so the database could not answer it cheaply and fell back to the scan every time. A small result does not imply a small query.
That is the moment the floor appeared. The lookup cost the same roughly two seconds whether a location had half a million items or a hundred, because the cost was the scan, not the answer.
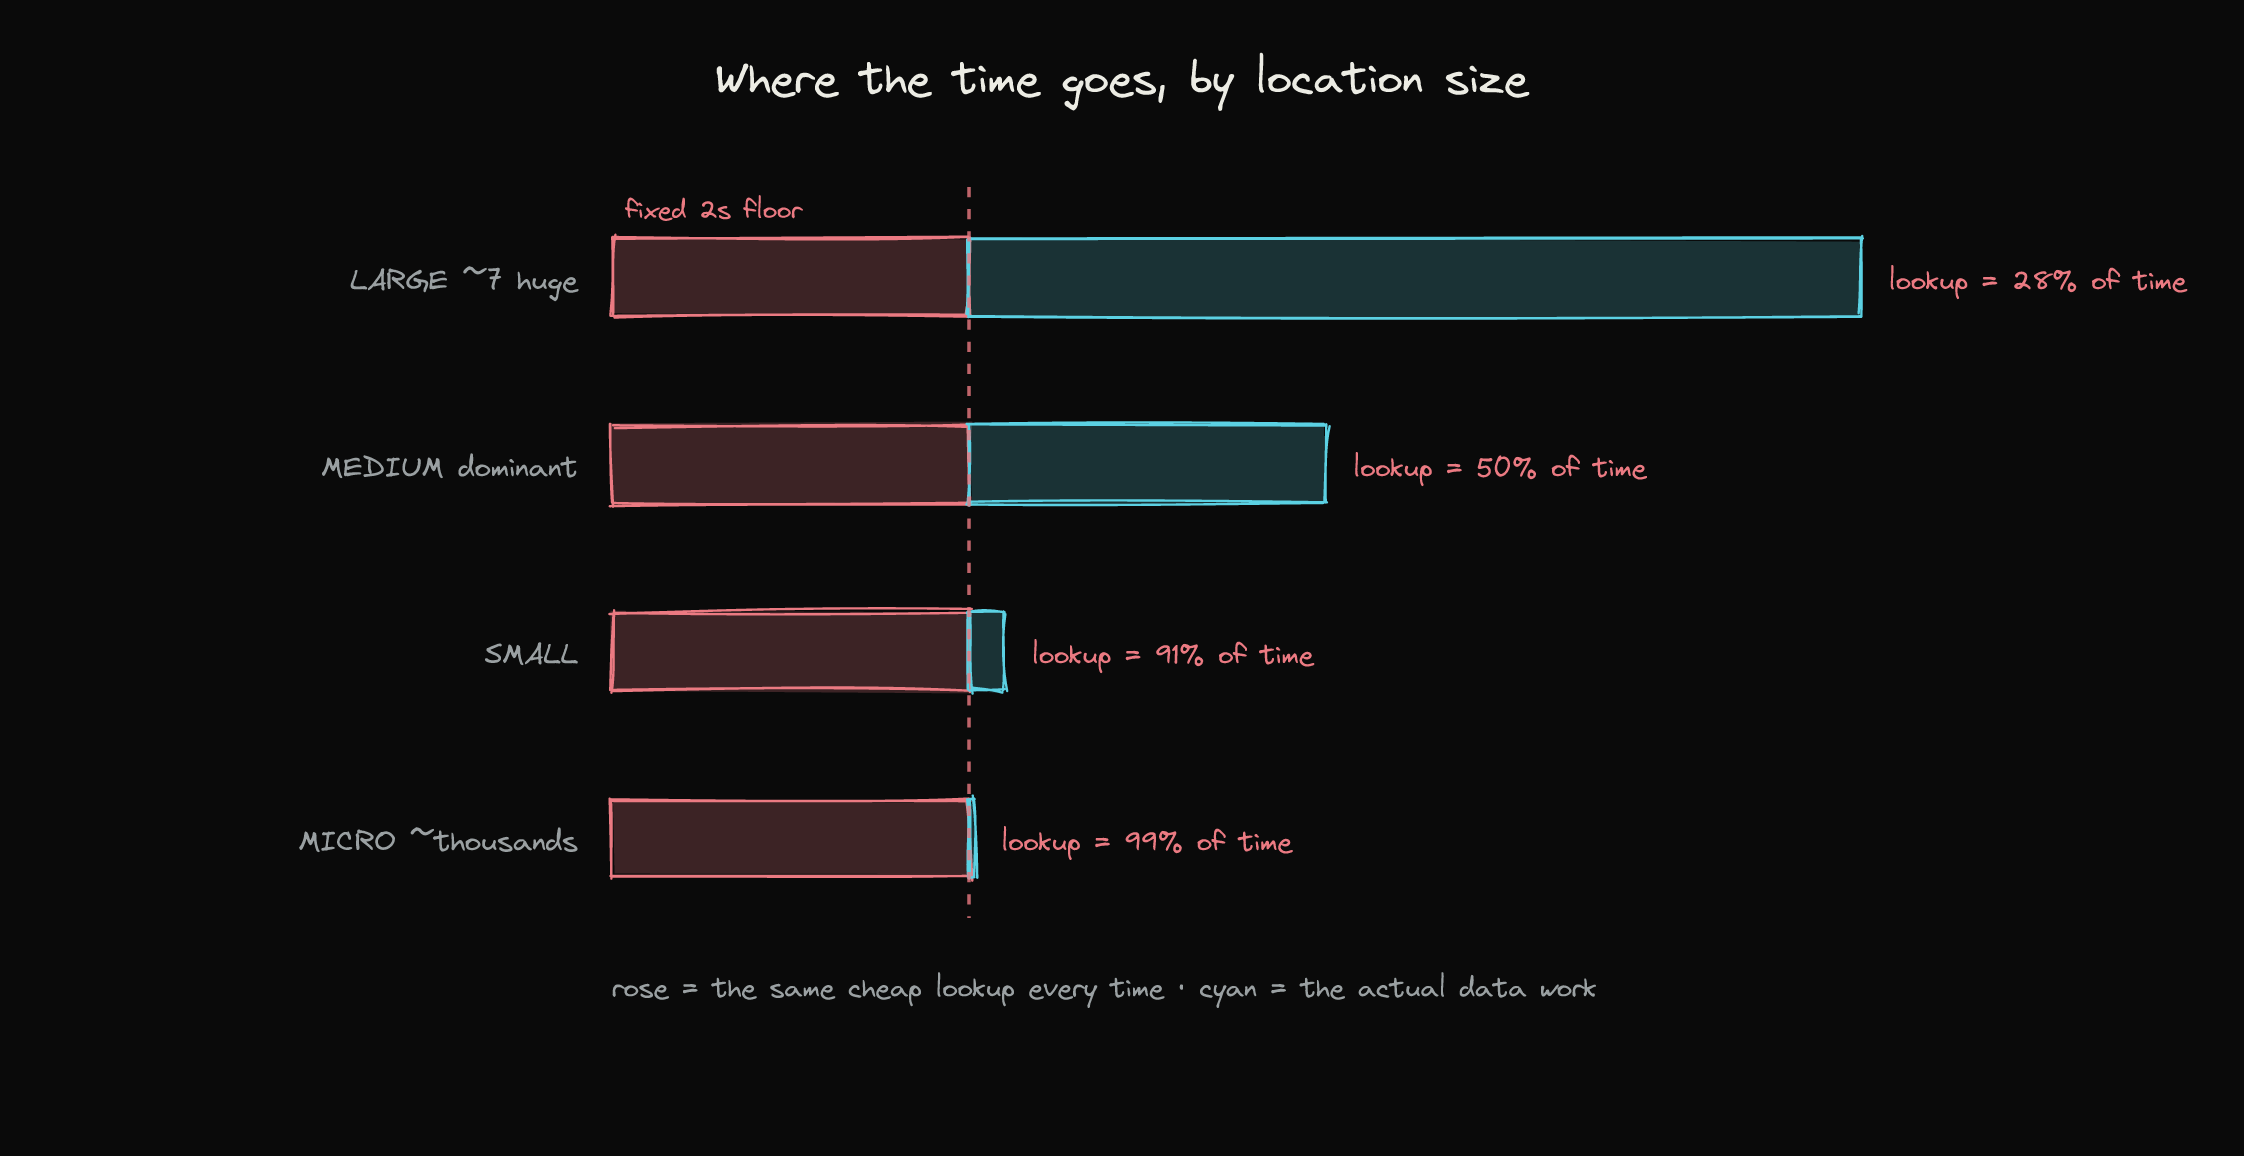
Broken down by size, the fixed cost is a flat line and the real work is everything stacked above it (illustrative figures):
| Location size | Data work | Fixed lookup | Lookup share |
|---|---|---|---|
| Huge | 5.0s | 2.0s | 28% |
| Medium | 2.0s | 2.0s | 50% |
| Small | 0.2s | 2.0s | 91% |
| Tiny | 0.02s | 2.0s | 99% |
On the big locations the floor hides in plain sight. Two seconds of lookup next to five seconds of real data work is a rounding error nobody profiles. But the job is mostly not big locations. It is thousands of tiny ones, and on a tiny location the real work is milliseconds while the lookup is still a flat two seconds. There, the cheapest query in the job was ninety-nine percent of the time.
Multiply it out. Two seconds, paid once per location, across a few thousand locations, is over an hour and a half of wall-clock time spent asking the same cheap question. The actual tens of millions of rows were not the bottleneck. The thing I would never have profiled was.
The reframe
The instinct when a query is slow is to make the query faster. That instinct is a trap here, because the query is not slow in any way that matters. It is cheap. The problem is not its speed, it is its position. It sits inside a loop that runs thousands of times, and its cost does not shrink with the work.
Once you see it as a fixed cost inside a loop, the math writes itself. Total cost is the per-iteration floor times the number of iterations, and it is completely independent of how much data you are actually processing. You do not optimize your way out of that. You get out of the loop.
The fix
The type of a location barely changes, and there are only a few thousand of them. So none of that work belongs in the loop. I pulled every location’s type once, in a single query at startup, into an in-memory map. Inside the loop, the lookup became a map read, which is effectively free.
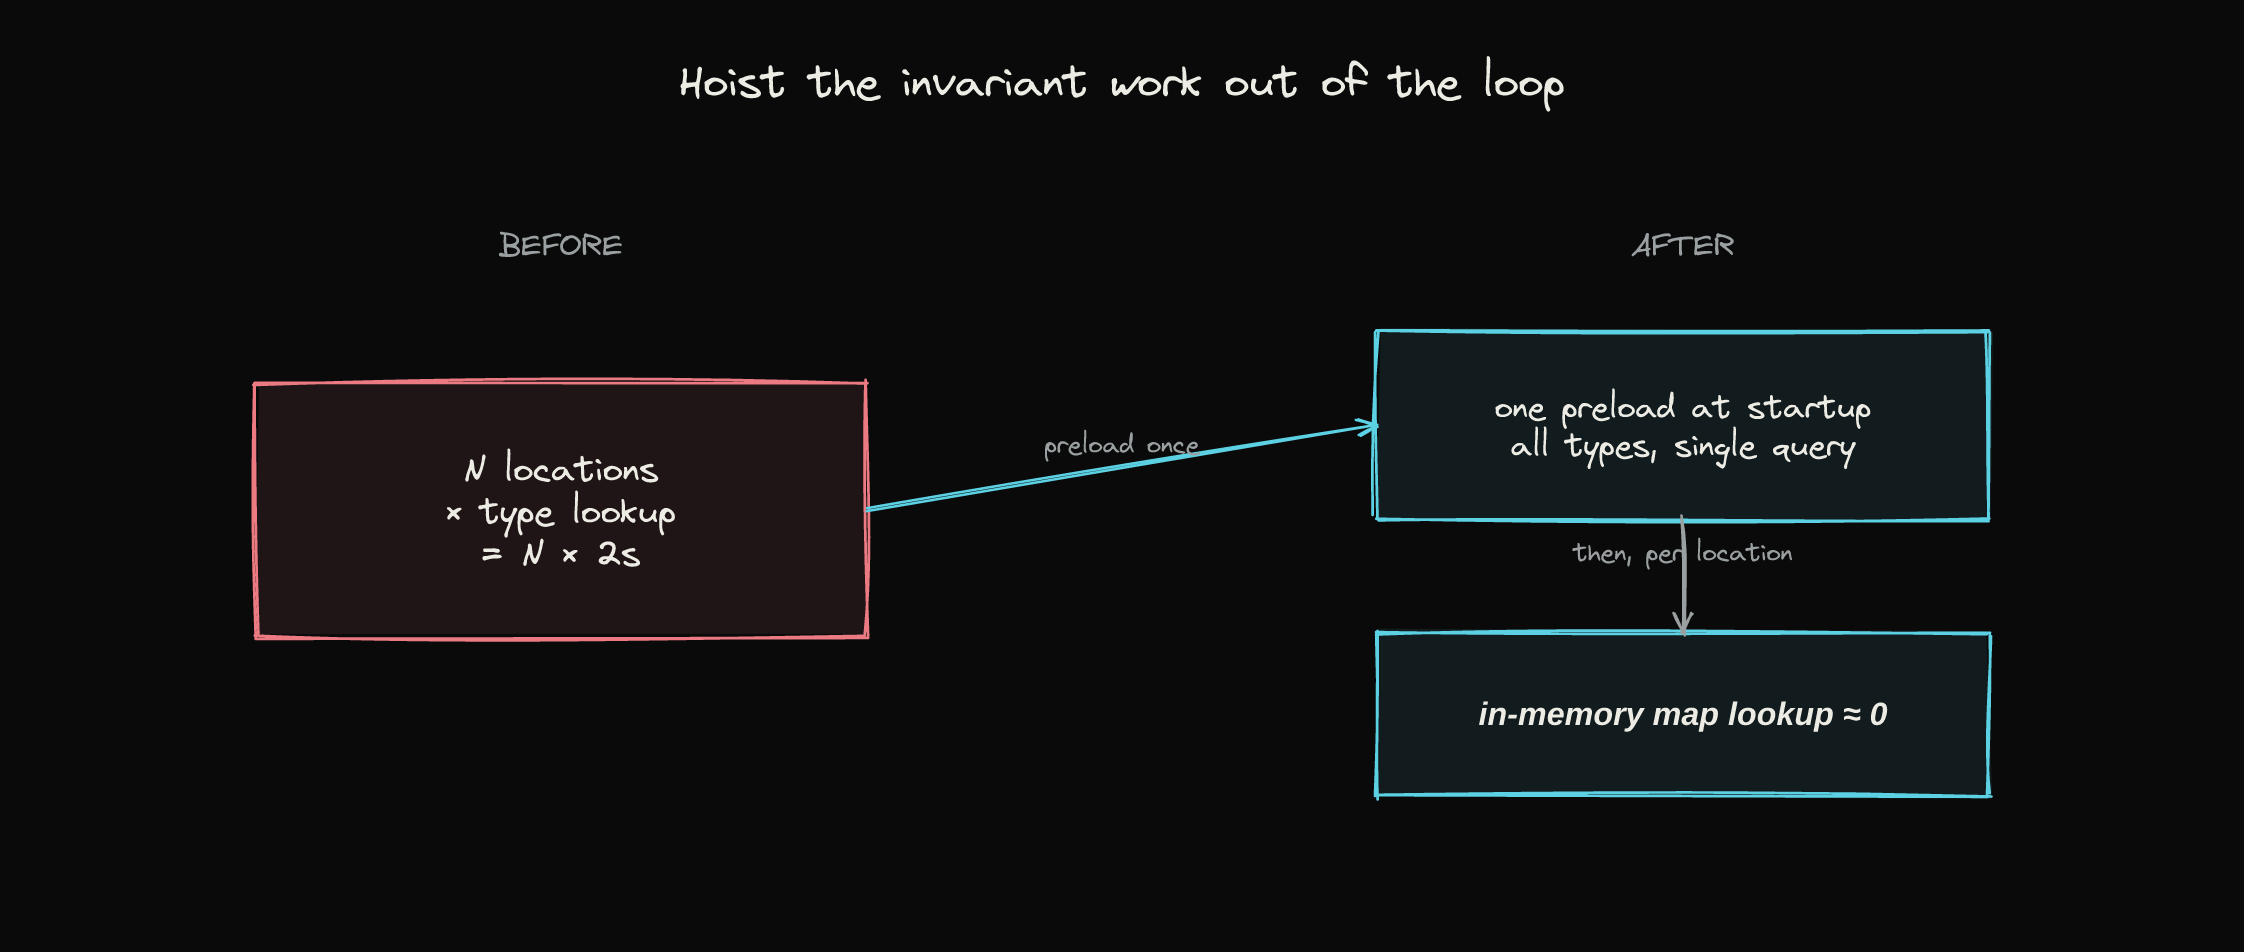
The before, with the cost buried in every iteration:
for (String location : locations) {
    // one row back, ~2s every time, even for a 150-item location
    String type = jdbc.queryForObject(
        "SELECT DISTINCT location_type FROM inventory WHERE location = ?",
        String.class, location);
    process(location, type);
}
The after, with the work hoisted out:
// once, at startup: every location's type in a single scan
Map<String, String> typeByLocation = jdbc.query(
    "SELECT DISTINCT location, location_type FROM inventory",
    rs -> {
        Map<String, String> m = new HashMap<>();
        while (rs.next()) m.put(rs.getString(1), rs.getString(2));
        return m;
    });

for (String location : locations) {
    String type = typeByLocation.get(location); // memory read, ~0
    process(location, type);
}
One scan at startup replaced a few thousand of them. The join I started from was the wrong fix: folding the type into the main query nearly doubled that query’s time, paying a version of the floor on every location, every run. A covering index would have made the original lookup an index-only scan and effectively instant, which is the right long-term fix, but it needed a schema change and a DBA, and the preload solved the whole thing in an afternoon with no migration.
Where else this hides
The specific query does not matter. The pattern is fixed-cost work sitting inside a per-item loop, and it shows up everywhere once you start looking.
What I had was an N+1 in disguise. The textbook N+1 fetches related rows, one query per parent: load a post, then a query per comment. Mine fetched nothing related. It fetched a static label, one query per location, work that should have run once. Same shape, different costume, which is exactly why it hid from review. A few more places it wears the costume:
- Acquiring a connection, or checking auth, or parsing a config inside the loop instead of once outside it.
- Query planning overhead on a statement you never prepared, paid fresh on every call.
- A cold lookup to a remote service per item, where the round trip, not the work, is the cost.
In every case the tell is the same. The per-item cost looks small, so nobody multiplies it by the iteration count, and the iteration count is large.
Why this happened
Nobody wrote slow code. The type lookup was written per location because the loop is per location, which is the natural place to put it. It survived because it was tested and demonstrated on the big locations, where two seconds genuinely is noise. The cost only became visible at the tail, across thousands of small locations that no one runs by hand. The defect was not in the query. It was that the floor was never multiplied by the loop.
Takeaways
Multiply before you optimize. A per-item cost is not a number, it is a number times your item count. Two seconds is nothing until it is a few thousand of them. Before you tune anything, write the multiplication down. It will often point somewhere other than where you were about to look.
The tail is where fixed costs live, so profile the smallest case, not just the biggest. Engineers test the scary large inputs. But a fixed cost is invisible there by definition, and it dominates on the many small inputs that make up most real workloads. The smallest, most numerous case is where the floor shows itself.
Hoist invariant work out of the loop. If something does not change per iteration, it does not belong in the iteration. Compute it once, hold it in memory, and read it. This is the oldest optimization there is, and the reason it keeps mattering is that the work hides as a small, reasonable-looking line in a place that runs a lot.
The slowest part of that job was the cheapest query in it. The fix was not to speed up the query. It was to stop asking it.