Throughput Is an Output, Not a Target
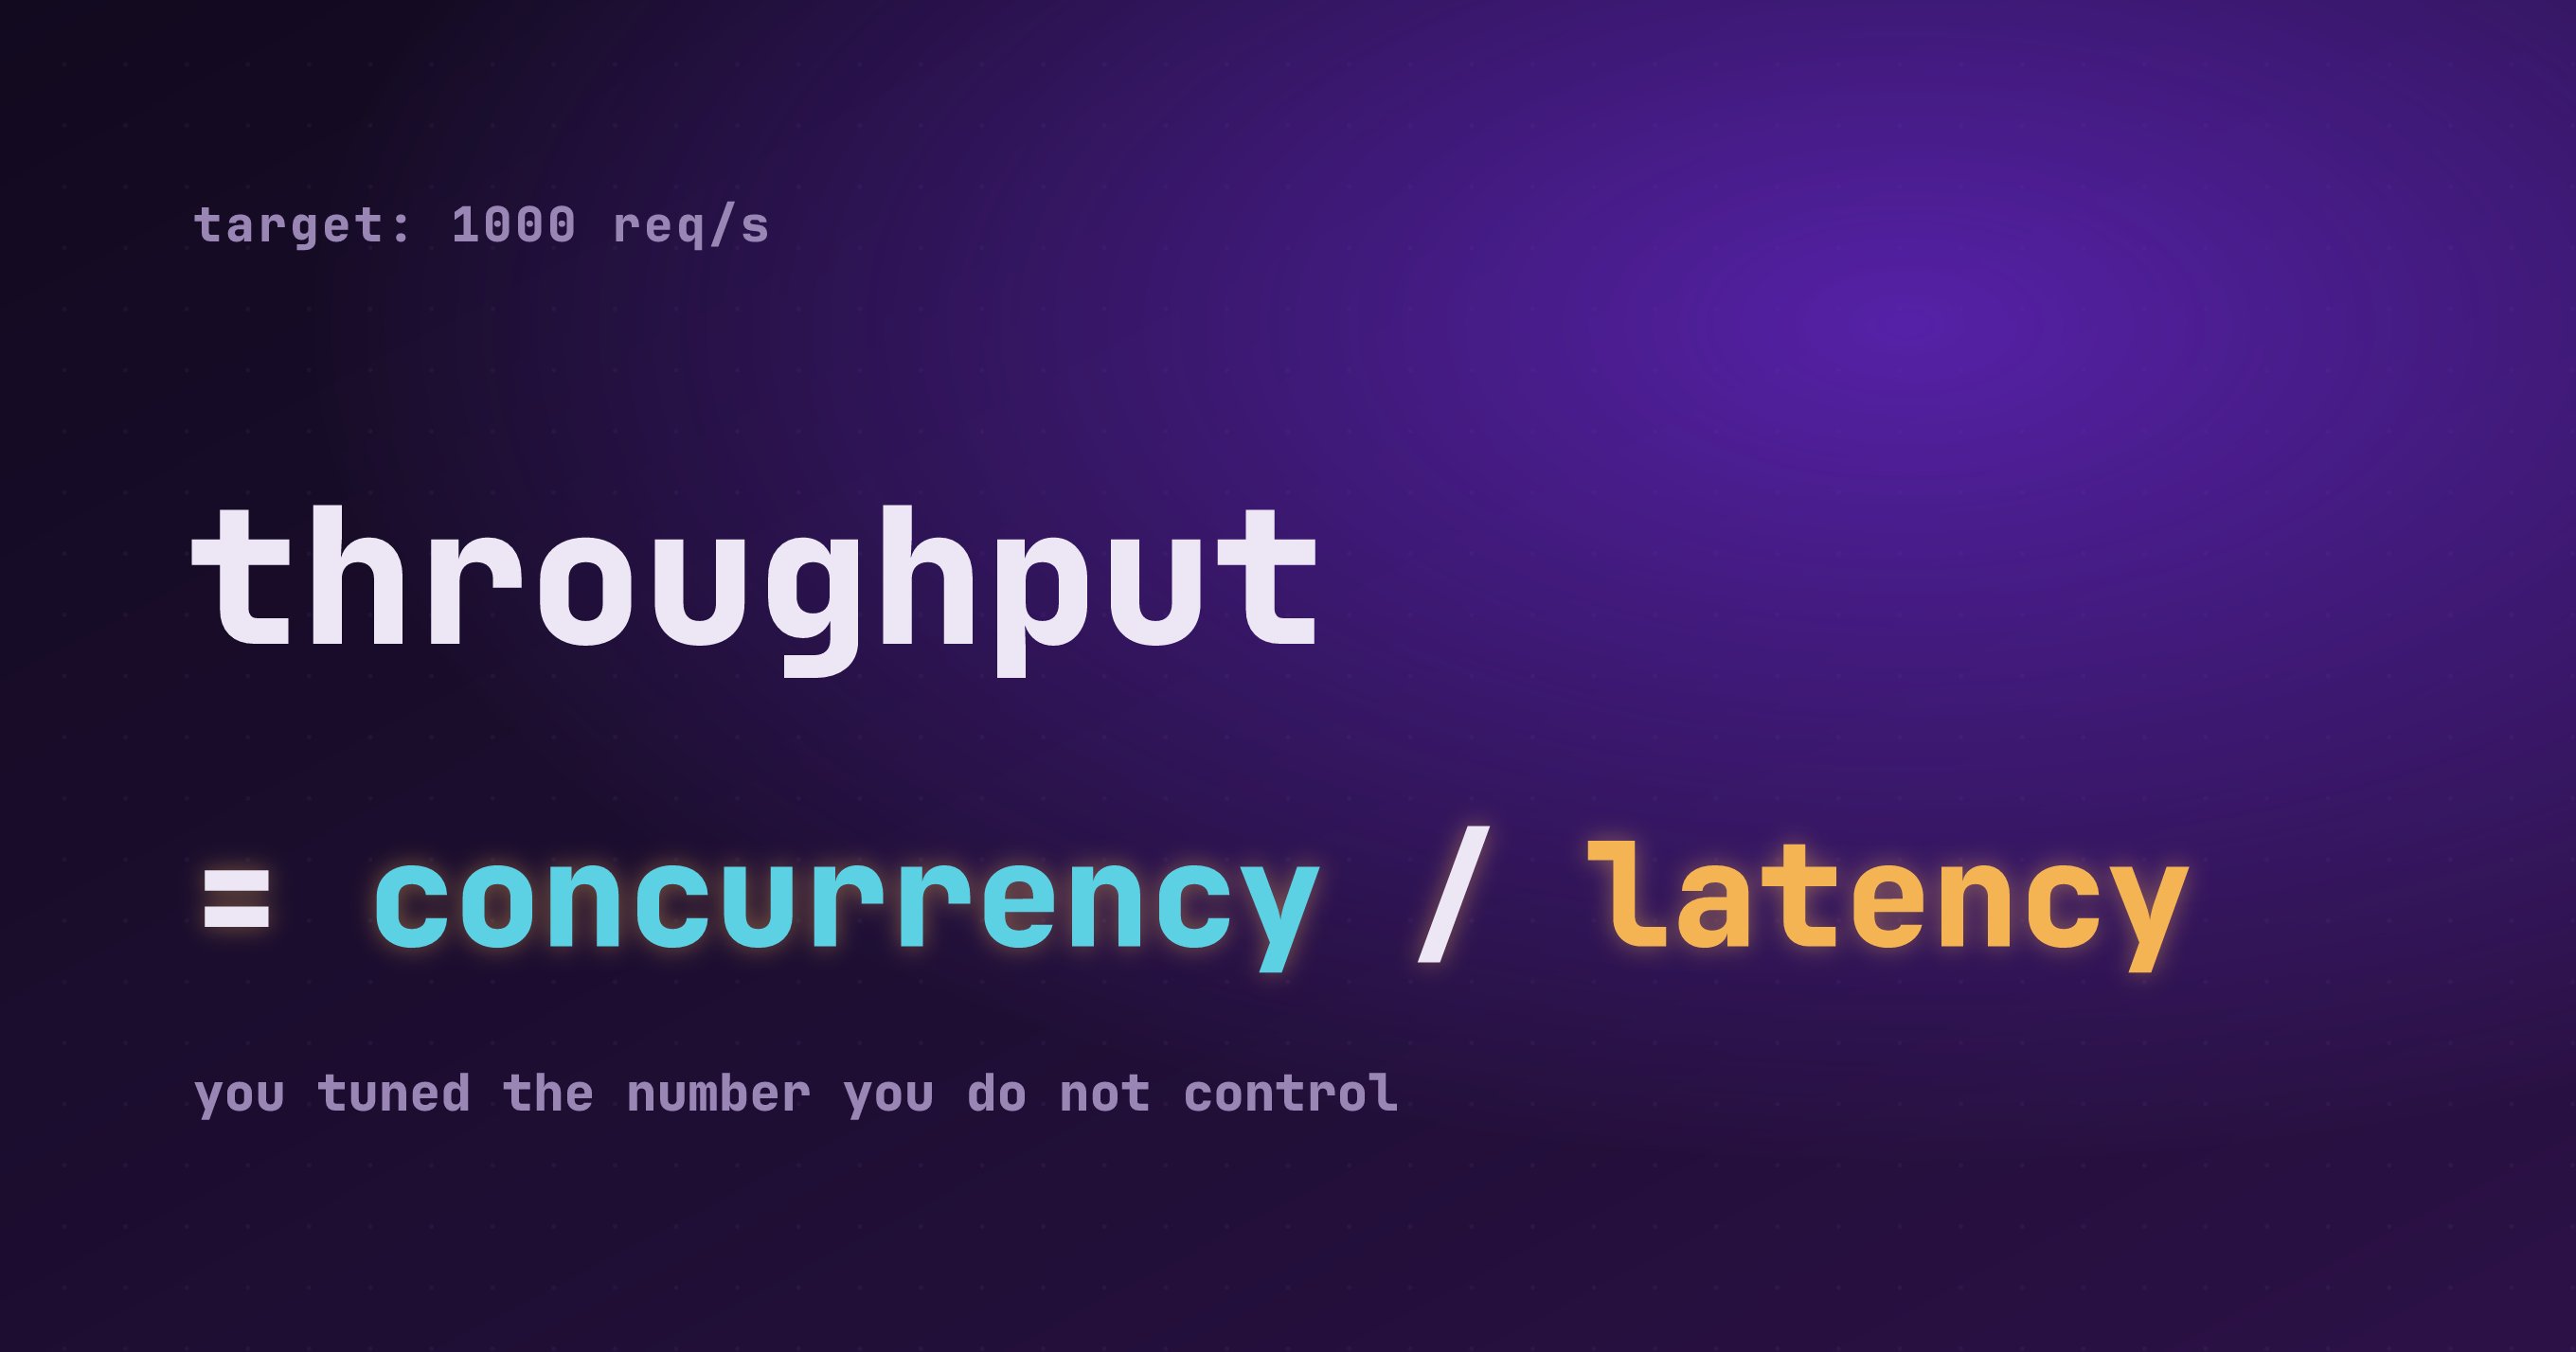
“In a stable system, the average number of requests in flight equals the rate they arrive times the time each one takes.” Little’s Law (L = λW)
We had a number to hit before launch: one thousand completed requests a second.
So we did what most teams do when handed a throughput mandate. We pointed a distributed load test at the cluster, set it to push a steady thousand requests a second, and stood around the dashboards turning the usual dials. More CPU. Wider database connection pools. Higher memory limits.
That framing was the mistake.
You do not dial throughput. Throughput is an output, not a setting. You earn it as a consequence of how efficient the system is, and the ceiling on that efficiency is set by two things we were not watching: how many requests can be in flight at the same instant, and how long each one holds its resources before it lets go.
The service did not have a throughput problem. It had a concurrency problem, caused by a single expensive request shape that did an unbounded amount of work. That one path quietly set a low concurrency ceiling, and the whole cluster ran into it. The cure was not more capacity. It was putting a limit on the work a caller could ask for.
A note on numbers: the figures here are illustrative and hypothetical, chosen to make the mechanics clear. The structural profile is the point, not the exact milliseconds.
Four terms, defined once:
Throughput: the rate at which the system completes requests, in requests per second. The rate coming out.
Concurrency: how many requests are inside the system at the same instant. Each one holds a finite resource while it waits: a thread, an open connection, a memory buffer, an execution slot.
Little’s Law: for any stable system, concurrency equals throughput times latency. Rearranged to solve for the thing we care about, throughput equals concurrency divided by latency. Slower requests buy less throughput per slot.
Request shape: the execution path a payload triggers. Many calls can hit the same URL and run completely different code, at completely different cost.
The setup
The endpoint is an inventory lookup. The caller passes a list of item ids and an optional list of locations to scope the answer, and gets back stock. We qualified it across a matrix of shapes: small batches of items or large ones, crossed with three location modes, one location, several, or none at all. None means no filter: return the item everywhere it exists.
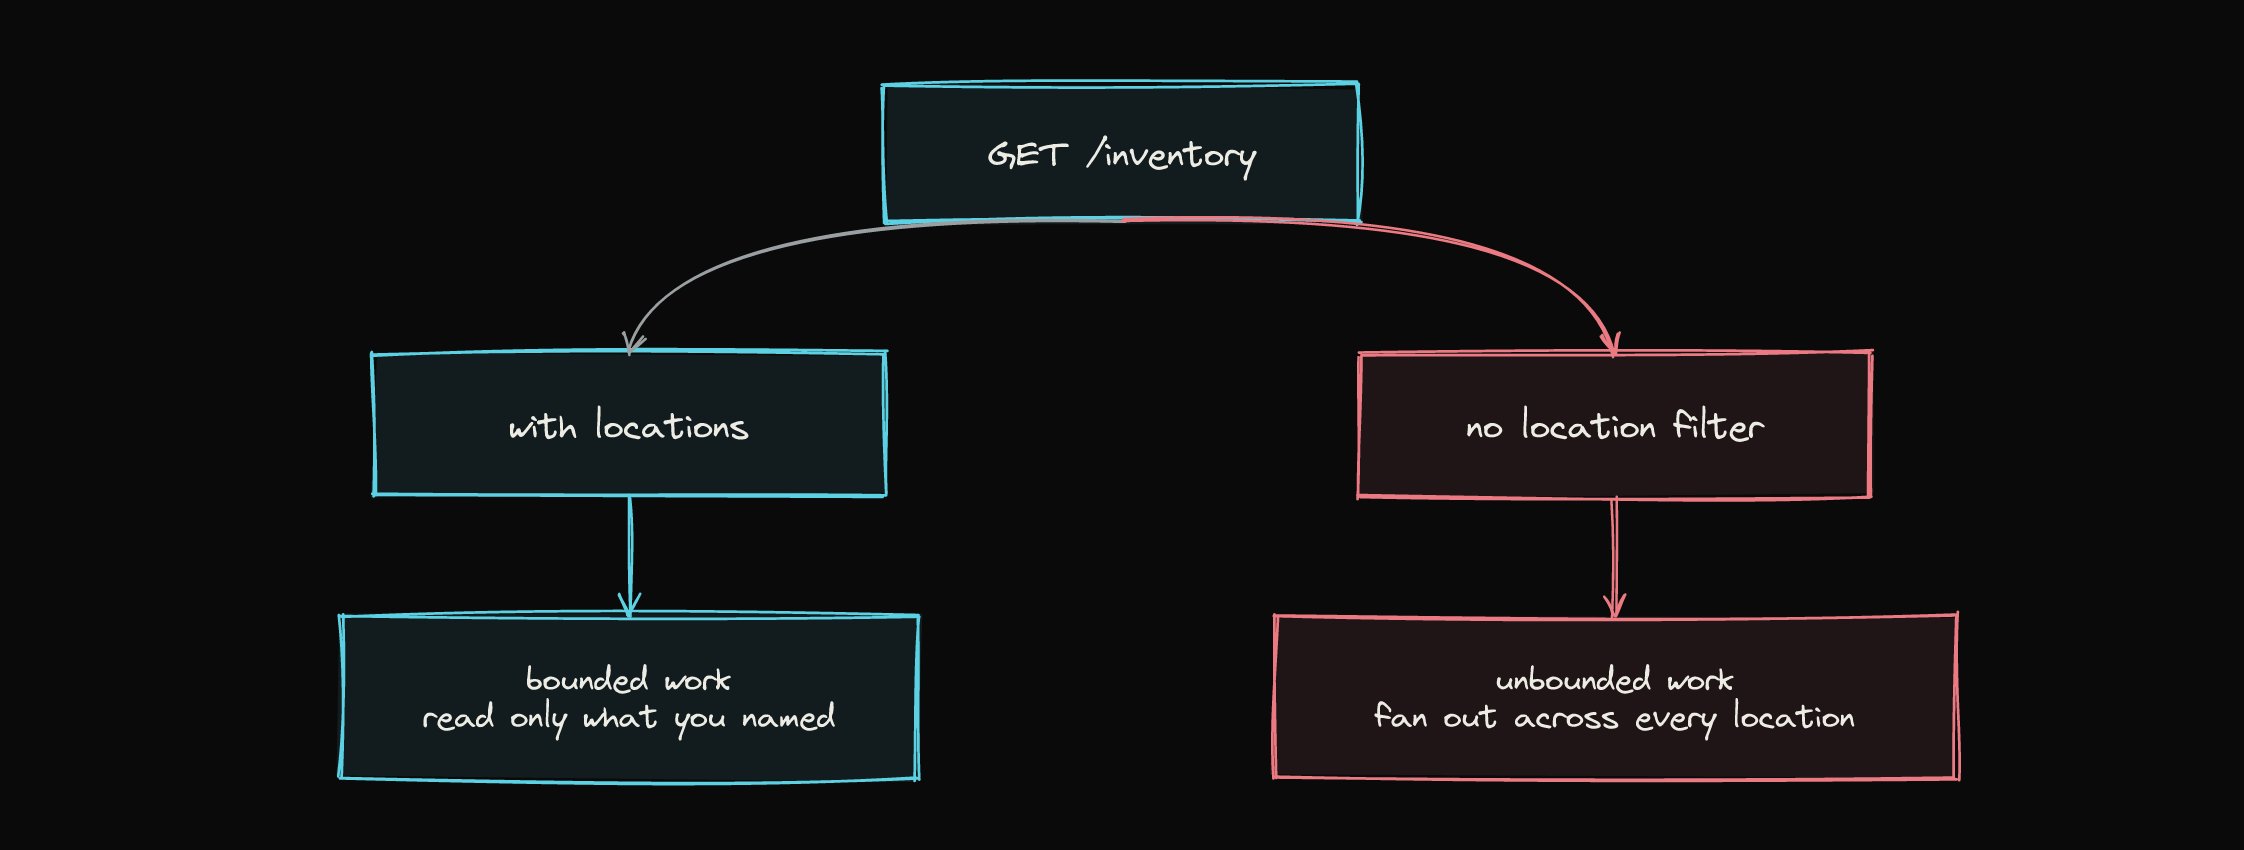
When the caller named locations, the path was bounded and fast. It read the keys it was asked for, evaluated the records, and returned in a few milliseconds. When the caller passed no location filter, the same endpoint started to degrade well before the load reached our target, climbing tail latency and then returning timeouts, while the bounded shapes right next to it on the same cluster looked fine.
The problem is the average
The first report was wrong, and wrong in the most ordinary way there is. The headline said the endpoint topped out at some rate, a single blended number averaged across the whole matrix. That average was a lie. Most shapes had plenty of headroom. One shape was collapsing under load, eating shared cluster resources, and dragging the aggregate down with it.
When the finding is “the endpoint is slow under load,” the reflex is to scale out: more instances, a bigger database tier, more cloud spend. That reflex is expensive, and here it would have bought nothing but a few months and a slightly different chart. You cannot scale your way out of a shape that has no ceiling.
Anatomy of an unbounded request
To see why the no-filter shape was different, look past the clean signature at the work it triggers.
When the caller names locations, the backend does a bounded, predictable lookup: read those items at those locations, done. When the caller omits locations, the system substitutes a permissive default, return stock for these items across every location in the network.
@GetMapping("/inventory")
public InventoryResponse lookup(
        @RequestParam List<String> itemIds,
        @RequestParam(required = false) List<String> locationIds) {

    if (locationIds == null || locationIds.isEmpty()) {
        // the unbounded path: every location the company operates
        locationIds = networkRegistry.getAllActiveLocationIds();
    }
    return inventoryService.fetch(itemIds, locationIds);
}
This passes code review without a second look. The cost is the problem, and the cost is invisible in the signature. The work this block does is not governed by what the caller asked for. It is governed by how large the network is. Open new locations, and this one request shape gets slower forever, even for a caller asking about a single item. The software is on a trajectory toward an outage, driven by nothing more than the business growing.
The concurrency wall
Now apply Little’s Law and watch the unbounded latency turn into a system killer. Throughput equals concurrency divided by latency.
Put our situation into those letters. L is the worker slots, the 200. The lambda is the arrival rate, the thousand requests a second we were told to hit. W is the time each request takes. We were handed the arrival rate as a target and tried to set it by force, but the law rearranges to throughput equals slots divided by latency, which makes the arrival rate a consequence of the other two, not a dial. With the slots fixed by the pool, the only honest levers were raising the slot count or lowering the latency.
A server does not have infinite slots. Whether it runs a thread per request, the classic model in something like Tomcat, or an event loop, the model in something like Netty, it works inside hard limits. Threads cost stack memory. Event loops are bounded by socket buffers and queue depth. Either way there is a finite number of requests that can be in flight before new ones have nowhere to go.
Take a node with a pool of 200 worker slots. If a healthy request takes 10 milliseconds, each slot can turn over 100 times a second, and the node can earn up to:
200 slots / 0.010 s = 20,000 req/sNow send the unbounded shape. It fans out across the whole network, so its latency swells toward two seconds. A slot holding one of those requests turns over once every two seconds, not a hundred times:
200 slots / 2.0 s = 100 req/sThat slot’s throughput fell from 100 requests a second to half of one. As more of these slow requests arrive, they occupy more slots, hold their database connections, hold their memory, and refuse to yield. The pool walks toward 100 percent saturation. At that point the cluster is at its concurrency wall, and because there are no free slots to accept a new connection, even the fast 10 millisecond bounded requests get rejected at the edge.
Read the law in its original form and the wall stops being a surprise. L equals lambda times W. Hold the arrival rate steady and let W climb, and the concurrency L has to climb with it, because the same number of requests arriving each second now each linger far longer before they leave. Rising latency does not only slow requests, it forces more of them to be in flight at once. That number climbs until it reaches the size of the pool, and the pool is the wall.
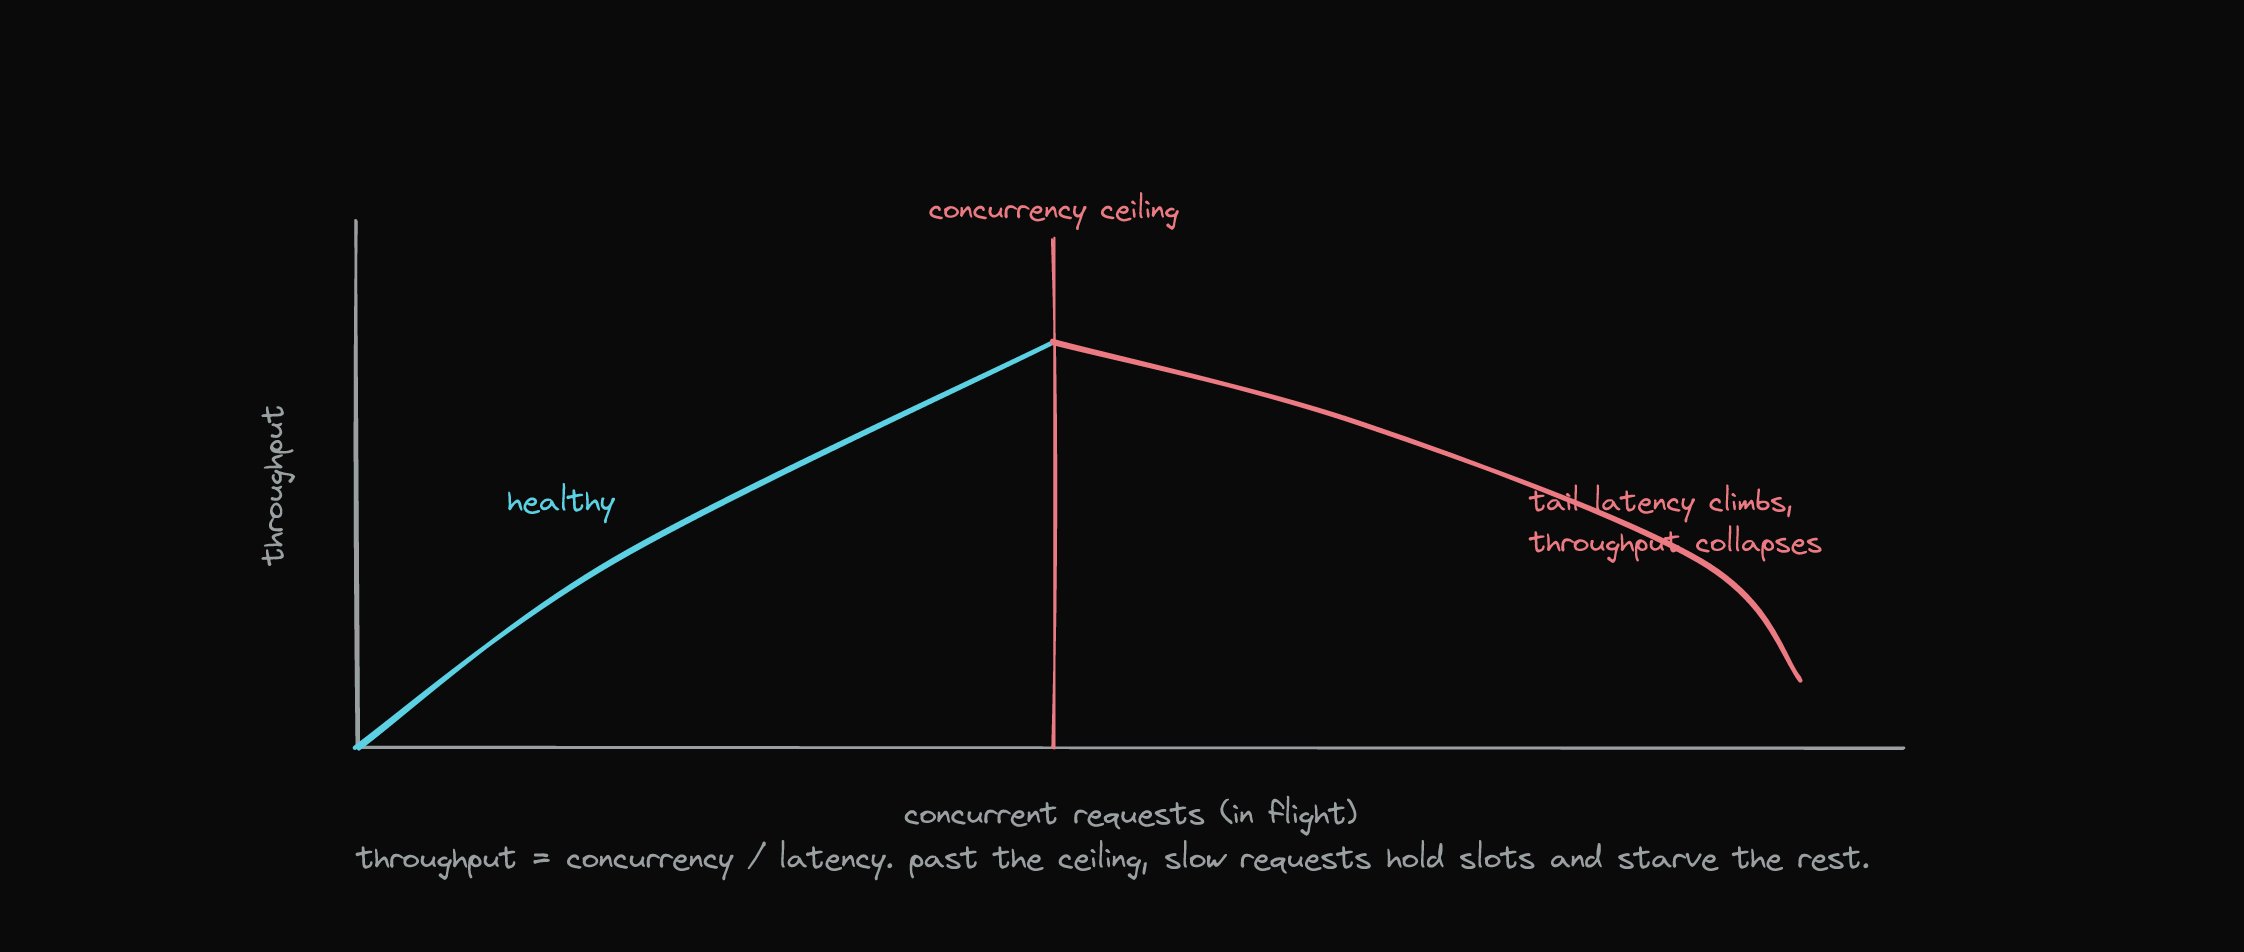
The system did not run out of speed. It ran out of slots, because one unbounded shape sat on shared capacity and would not let go. Adding pods raises the wall, it buys more slots, but it does nothing about a shape whose latency grows with the data. You are renting capacity to hide an algorithm that gets worse every quarter.
Once you see the ceiling as a concurrency number instead of a throughput number, the question changes from “how do we go faster” to “what is holding the slots, and why.”
Isolating the shapes
The diagnostic that turned the blur into a finding was almost too simple: stop testing the endpoint, and test each shape on its own. One scenario running only bounded queries, another running only the no-filter query, each under its own pressure.
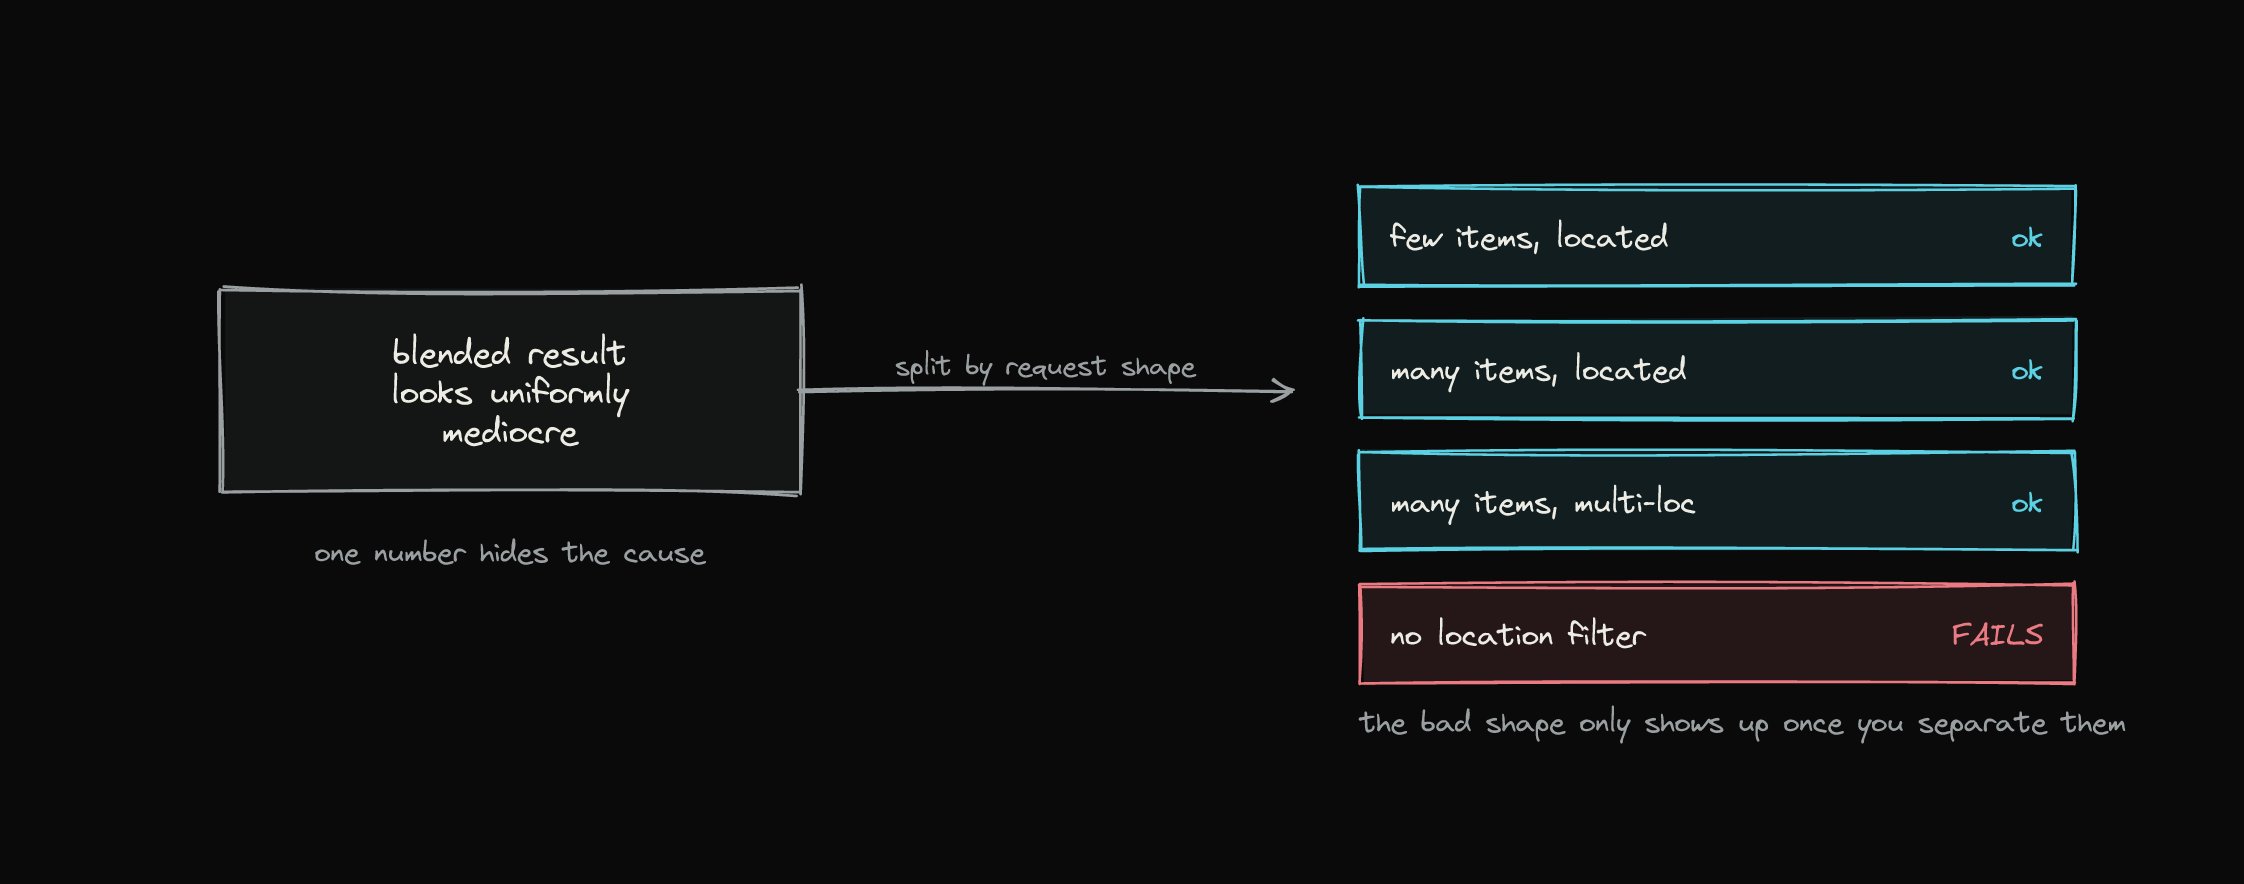
Separated, the picture was plain. The bounded shapes were production ready. The no-filter shape was the entire problem, and it had been hiding inside a blended average that made everything look uniformly mediocre.
This is the reusable idea, and it is worth saying flatly:
One endpoint can be several programs wearing the same URL.
A blended load test reports the average of programs that have nothing to do with each other, and the true limit always hides inside the worst one.
The fix
The remedy stops being a guessing game once the mechanism is clear. The rule is simple: no caller can trigger unbounded work. There are three honest ways to hold that line, in rough order of preference.
Reject the unbounded call outright. Delete the permissive “all locations” default. If the scope is missing, fail fast at the edge with a 400, and make the caller name what it wants.
if (locationIds == null || locationIds.isEmpty()) {
    throw new BadRequestException("locationIds is required");
}
Bound it with pagination. If some use case truly needs broad data, never return it in one shot. Cap the fan-out per page to a safe internal limit and hand back a token for the next page, so a single request can only ever do a fixed slice of work.
Make it asynchronous. If a large dataset truly has to be assembled, take it off the request thread entirely. Accept the job, return a 202 with a tracking token, do the heavy work on a separate pool, and let the caller poll a precomputed view when it is ready.
Where else this hides
The unbounded shape is one face of a pattern: a caller input that drives work proportional to your total data instead of to the request. It shows up all over:
- An administrative job or query that runs
DELETE FROM ledger WHERE status = 'EXPIRED'with noLIMIT. As history grows, the lock it holds grows with it, and one cleanup freezes the table. - A search that runs an unindexed
LIKE '%term%'across a large table, forcing a full scan that gets slower with every row added. - A GraphQL or dynamic JSON layer that lets a client request arbitrarily nested relationships with no depth limit or cost analysis on the server.
Each one looks fine in review and on a small dataset. Each one sits on a growth curve toward the day the data is big enough to take it down.
Takeaways
Throughput is a derivative, so measure the inputs. When a system will not go faster, do not chase the arrival rate. Look at concurrency and latency and find which one is binding. You are almost always out of slots, not out of speed, and something slow is holding them.
Test each request shape on its own. One URL can be several programs. A blended average reports a number that describes none of them and hides the one that is broken. Isolate the shapes, push each, and read the worst.
An unbounded operation is an outage with a delay. Any request that can trigger work proportional to your total data, rather than to what the caller asked for, will eventually meet the input that takes the system down. Put a ceiling on it, with a hard parameter, a page size, or a timeout, before your data does it for you.
Little’s Law is not a suggestion, it is arithmetic. We spent weeks tuning the one quantity it says you do not control, while the thing that set our ceiling sat in plain sight: a single request shape that could ask the system to do an unbounded amount of work.